How would you diagnose a memory leak in a production Node.js process?
I have spent late nights staring at DataDog dashboards, watching memory graphs climb until the inevitable "Out of Memory" crash. In my experience working on high-traffic Node.js applications, a memory leak is not just a bug. It is a ticking time bomb.
Diagnosing this in production is high stakes. You cannot simply attach a debugger and pause execution when thousands of users are active. You need a strategy that is safe, methodical, and evidence-based.
Here is my protocol for hunting down leaks without taking down production.

Step 1: Confirm the Leak with Metrics
Before you blame the code, you must look at the infrastructure. You need to distinguish between a leak and a heavy workload.
I always start by comparing RSS (Resident Set Size) against Heap Used.
- RSS is the total memory allocated to the process by the OS.
- Heap Used is what your JavaScript objects actually occupy.
If your RSS grows indefinitely while Heap Used remains stable, you might have a leak in native C++ bindings (like an image processing library). If both grow and never return to a baseline after Garbage Collection (GC) runs, you have a JavaScript memory leak.
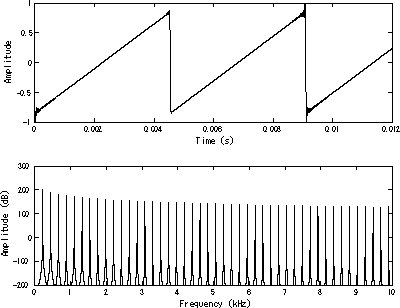
The Sawtooth Pattern In a healthy application, the memory graph looks like a sawtooth. It rises as objects are created and drops sharply when GC kicks in. In a leaking application, the "floor" of that sawtooth keeps getting higher.

Step 2: Capture the Evidence (Safely)
This is the most dangerous step. Taking a heap snapshot allows you to inspect memory, but it is a synchronous operation. It pauses the main thread. If your heap is 2GB, your server might freeze for several seconds. In a distributed system, this will cause health checks to fail and the load balancer to kill your instance.
The Safe Protocol:
- Isolate the instance. Remove the specific pod or container from the load balancer rotation.
- Trigger the snapshot. I prefer using the built-in
v8module over external libraries likeheapdumpwhen possible (https://nodejs.org/en/learn/diagnostics/memory/using-heap-snapshot). It is native and reliable. - Use Signals. I often implement a listener for a specific system signal (like
SIGUSR2) to trigger the snapshot without needing an HTTP endpoint exposed to the public.
Here is the TypeScript snippet I use to safely extract a snapshot:
import { writeHeapSnapshot } from 'v8';
import { logger } from './utils/logger';

// Do not run this on the main public port
// Trigger via a signal or a secured admin endpoint
process.on('SIGUSR2', () => {
  const fileName = `/tmp/heap-${Date.now()}.heapsnapshot`;
  logger.info(`Starting heap snapshot: ${fileName}`);

  // This is blocking. Ensure traffic is diverted first.
  const path = writeHeapSnapshot(fileName);

  logger.info(`Heap snapshot written to: ${path}`);
});
Step 3: Analyze the "Retainers"
Once you have the .heapsnapshot file, load it into Chrome DevTools (Memory tab).
You do not want to look at Shallow Size (the size of the object itself). You want to look at Retained Size. This metric tells you how much memory would be freed if that specific object were deleted.
The Comparison Technique:
- Take a baseline snapshot after the server starts.
- Run a load test or wait for traffic.
- Take a second snapshot.
- In DevTools, select "Comparison" view.
Sort by Delta. You are looking for objects that are created but never deleted.
Most memory issues can be solved by determining how much space our specific type of objects take and what variables are preventing them from being garbage collected.Step 4: Identify the Usual Suspects
In my career, 90% of leaks come from three sources.
1. Unbound Event Listeners This is the most common culprit. You attach a listener to a singleton (like a global socket connection) but never remove it. The listener holds a reference to the scope it was created in, keeping everything alive.
2. The Global Cache Trap
Developers often create a simple object to cache data.
const cache = {};
Without a cleanup strategy (like LRU), this object grows forever.
3. Closures A function inside a function can keep the parent's variables in memory. If the inner function is stored globally, the parent's scope never dies.
Related reading from my blog
Understanding how JavaScript handles execution and references is critical to preventing these issues. I break down the underlying mechanics in this article:
Next Step
Do you have a suspect service showing that "rising floor" pattern on your dashboard? I can help you write a safe script to capture snapshots during your next maintenance window.
